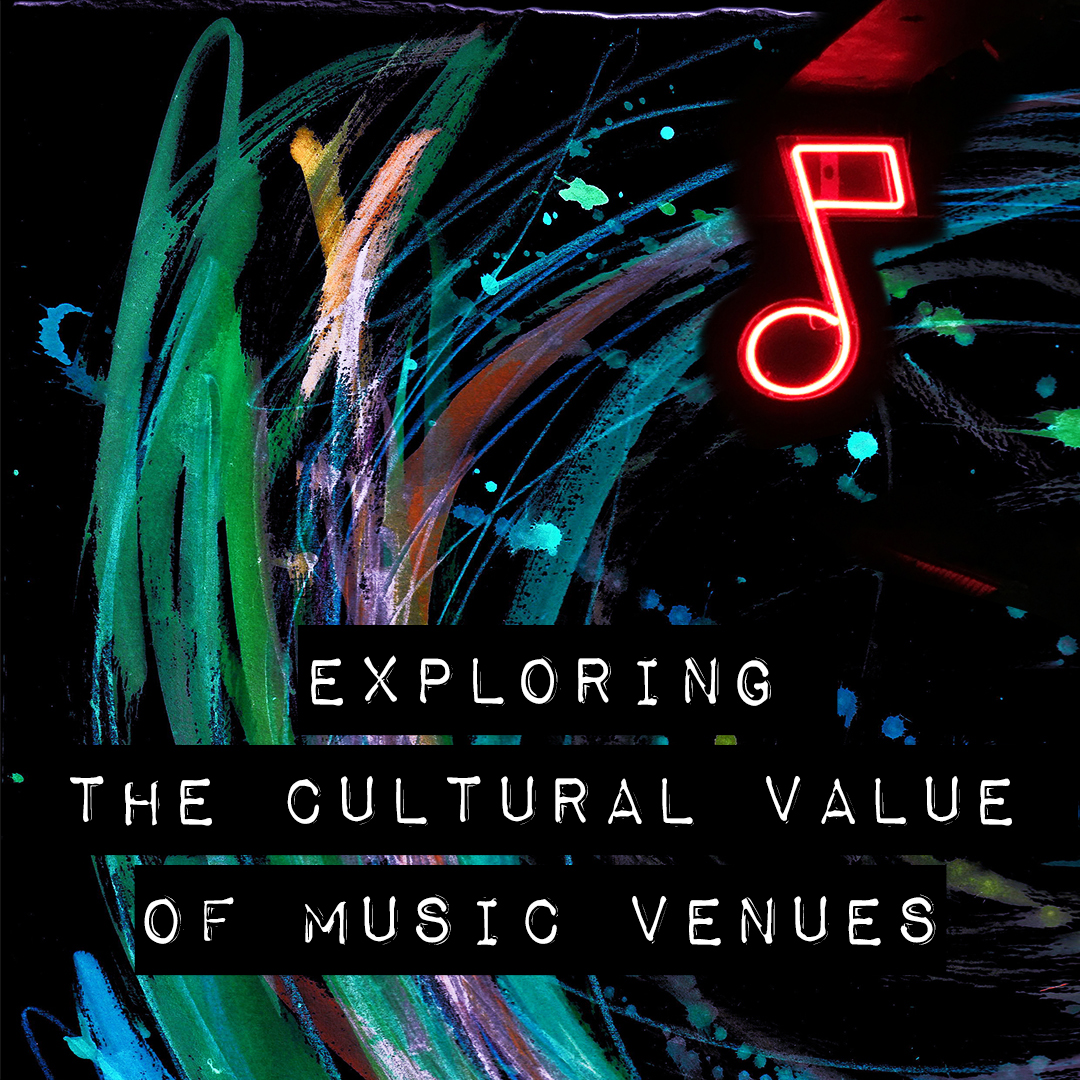
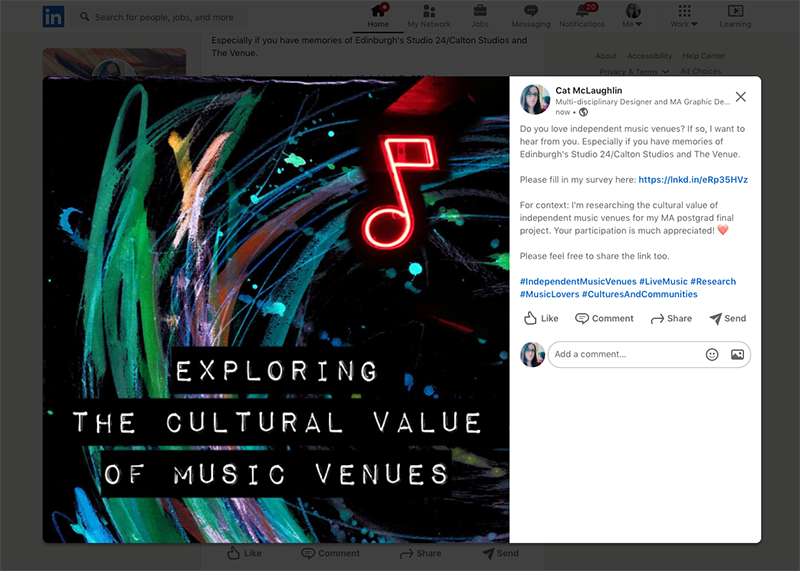
This week, I set up a survey using Google Forms to collect people’s opinions on independent music venues and their memories of certain lost Edinburgh venues. I put together the above image for the purposes of sharing the survey link on social media, as I generally find that posts with an image tend to gain more traction. The image is based on a piece I created for my love letter to live music in GDE720, which I have used as the background, cropped to a square and added copy to, in a typeface that visually fits the context.
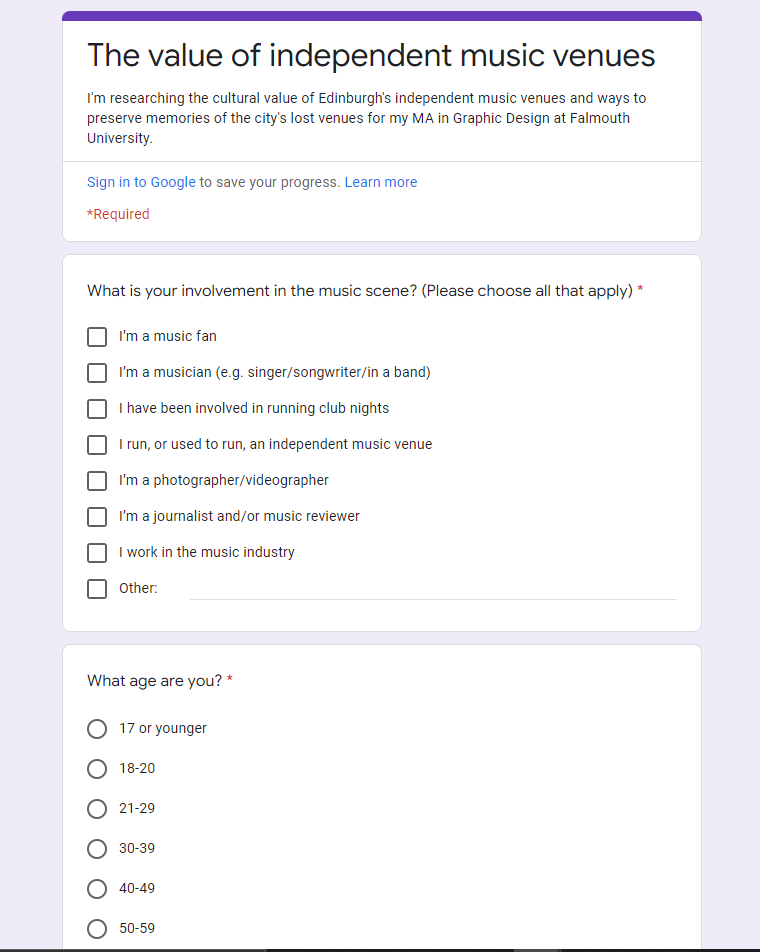
I decided that using a survey format would allow me to collect additional responses, without being limited by having to conduct individual interviews. I feel this data will naturally complement the direct conversations I have been having.
Interview with an ex-Edinburgh music fan
I interviewed Helen, who used to attend Studio 24 for club nights, and currently lives in Amsterdam. She has also lived near Geneva, just over the border in France (Ferney-Voltaire), as well as having lived in Berlin and London. I thought it would be interesting to get her perspective as she has experienced independent music venues all over Europe, and met her husband while clubbing in Edinburgh.
This time I tested out the Otter.ai “auto-transcribe” feature while recording the audio of our conversation, which worked pretty well, however it is limited to 30 minutes at a time. That said, I recorded the full chat and can transcribe the rest as needed. Looking over the transcript of the first segment afterwards, it was fairly accurate on the whole but did need some tidying up/corrections.
Peer session 08/04/22
Interviews with two more music fans who have links to Edinburgh’s music scene.
I spoke to a few more individuals on the topic of Edinburgh’s music scene specifically, asking them about their memories of the city’s lost venues (particularly in the Calton Road area), as well as their views on the value of independent music venues as a whole.
Both of these interviews were recorded directly using the Otter app to transcribe live. Once the conversations were completed, I then went into the auto-created transcripts to review these and corrected them as needed.
Data Visualisation
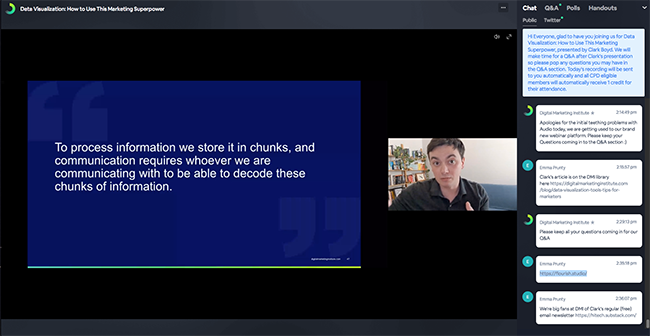
On 20th April, I attended a webinar hosted by the Digital Marketing Institute on how to improve and optimise the way data is visualised. My intention was to get some insights on different ways of presenting information visually, so it was good to get some key pointers on this, including honing in on the most vial facts/data, creating the right type of visual to suit, and represent the data (and intended audience), keeping the visuals clean/simple and easy to understand, and using labelling/annotations effectively. The presenter also signposted to some useful resources and tools, including Flourish, which can be used for data visualisation and storytelling.
References
Digital Marketing Institute. 2022. Available at https://digitalmarketinginstitute.com [accessed 11/04/2022]
Flourish. Available at https://flourish.studio/ [accessed 20/04/2022]